Winning Strategy: How to Succeed in Day Trading as a Beginner?
Day trading is a thrilling and potentially profitable venture, but it requires a structured approach and a deep understanding of the tools at your disposal. In this presentation, we will introduce you to a straightforward yet effective day trading strategy that leverages the power of the EasyTrendFollower indicator.
This indicator is renowned for its simplicity and ability to identify trends in the market. As a trend-following tool, it helps traders spot potential entry and exit points, allowing for well-timed and informed trading decisions.
Understanding the EasyTrendFollower Indicator
The EasyTrendFollower indicator is a very powerful technical tool used by traders to identify market entry and exit points.
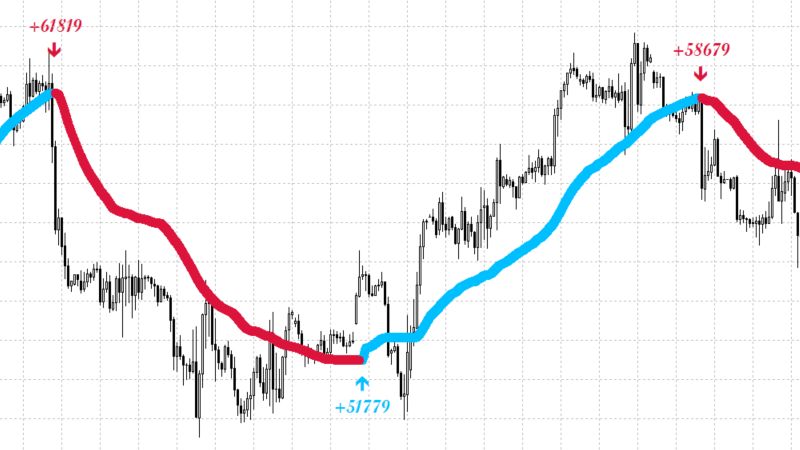
- When the indicator line is plotted below the price in blue color, it suggests an uptrend in the market. This is an indication of potential buying opportunities.
- Conversely, when the indicator line is plotted above the price in red color, it suggests a downtrend. This is an indication of potential selling opportunities.
- Simplicity: It is easy to understand and implement, making it ideal for traders of all experience levels, including beginners.
- Trend Identification: It excels at identifying trends in the market, allowing traders to align themselves with the prevailing price direction.
- Clear Entry and Exit Signals: The change in indicator color provide clear signals for entry and exit points.
- Traders can adjust this indicator parameters to suit their trading style and the specific assets they trade.
- The "Deviation" parameter allows the trader to adapt the indicator with the volatility of the asset.
Entry Points
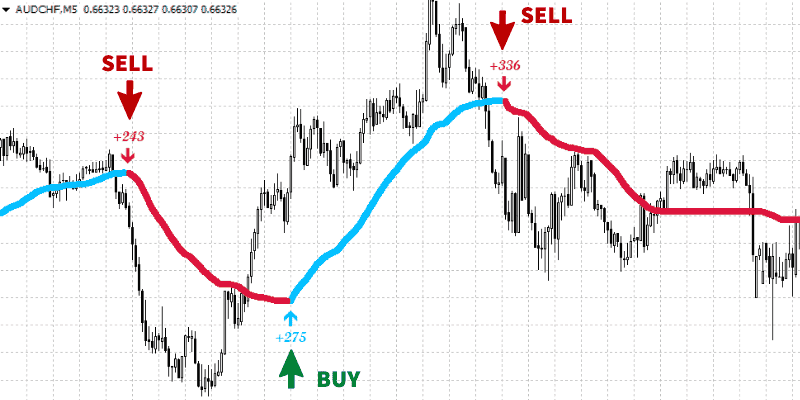
- Wait for the indicator line to change from RED to BLUE. After the color change, Initiate a buy entry if the indicator shows a blue upward pointing arrow.
- Wait for the indicator line to change from BLUE to RED. After the color change, enter a sell order if the red downward pointing arrow is displayed.
- Once in a trade, it's essential to manage it effectively.
- Consider setting a stop-loss order below the recent swing low for long trades and above the recent swing high for short trades.
- Traders can also use a trailing stop-loss, adjusting it as the price moves in the intended direction, to protect profits in case of a trend continuation.
Exit Points
In day trading, knowing when to exit a trade is just as crucial as finding the right entry point. Properly managing exit points is vital for protecting profits and minimizing potential losses. In this winning day trading strategy using the EasyTrendFollower indicator, we will focus on effective exit strategies for both long (buy) and short (sell) trades.
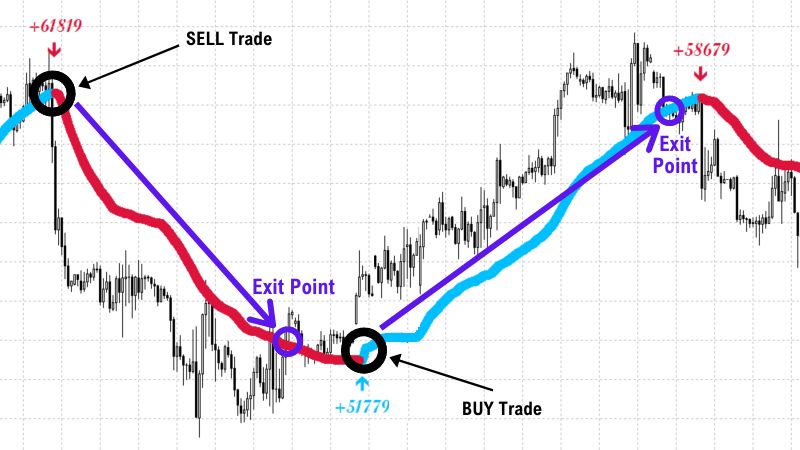
1. Exit signal: For long trades, we exit when the price breaks below the blue line of the indicator.
2. Take Profit (Optional): Traders may set a predetermined profit target based on their risk-reward ratio or technical analysis. If the price reaches the target, the trade is closed with a profit.
3. Trailing Stop-Loss: Another exit strategy is to use a trailing stop-loss. As the price moves in the desired direction (upward), the stop-loss level is adjusted accordingly, trailing behind the price to protect profits in case of a trend reversal.
1. Exit signal: For short positions, we exit when the price breaks above the red line of the indicator.
2. Take Profit (Optional): Similar to long trades, traders may set a predetermined profit target and close the trade if the price reaches that level.
3. Trailing Stop-Loss: Employing a trailing stop-loss is also suitable for short trades. As the price moves in the intended direction (downward), the stop-loss is adjusted accordingly to secure profits if the trend reverses.
Risk Management and Position Sizing
Successful day trading requires more than just finding profitable entry and exit points. Proper risk management is a fundamental aspect of any winning strategy. Implementing risk management techniques will help you safeguard your trading capital, avoid significant losses, and trade with confidence. Let's explore essential risk management principles and position sizing for our day trading strategy using the EasyTrendFollower indicator.
- Determine how much of your trading capital you are willing to risk on each trade. A common rule of thumb is to risk no more than 1% to 2% of your total trading capital on a single trade.
- Establishing a risk tolerance ensures that a string of losing trades won't deplete your capital rapidly.
- Position sizing refers to determining the number of shares, lots, or contracts you will trade based on your risk tolerance and the distance between your entry and stop-loss levels.
- A general guideline is to calculate your position size in a way that, if the stop-loss is hit, you lose no more than the predetermined percentage of your trading capital.
- Let's assume you have a trading capital of $10,000, and you're willing to risk 1% of your capital on each trade.
- You enter a long trade with an entry price of $50, and you set the stop-loss at $48, two dollars below your entry price.
- With a 1% risk per trade, the maximum loss you're willing to take is 1% of $10,000, which is $100.
- Now, calculate the position size using the difference between the entry price and the stop-loss: $50 (entry) - $48 (stop-loss) = $2.
- To risk a maximum of $100 on this trade, you can buy $100 / $2 = 50 shares (rounded down to the nearest whole number).

