The Best Support/Resistance Indicator
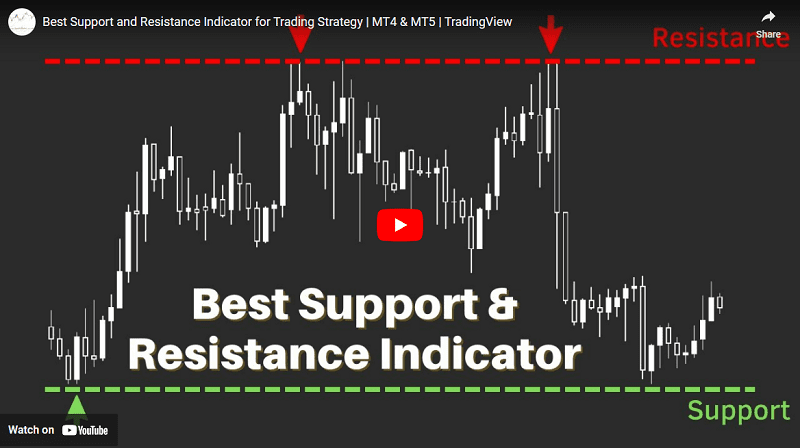
As you know, the best basic trading strategy in the market is to buy an asset when prices are at the support level and to sell when prices are at the resistance level, because investors are looking for the support and resistance levels most respected by the market, therefore the most relevant and the best.
In technical analysis, the most advanced and popular support & resistance indicator among professional traders is called "Support/Resistance Line Detector", it automatically spots and plots the most important support and resistance levels on charts.
Its advantage is that it is quite simple, so even a novice trader can easily use it.
Support and resistance are the bread and butter of technical analysis, they are the most widely used levels in the trading world.
How to trade with support and resistance?
There are two main trading techniques using support and resistance levels:
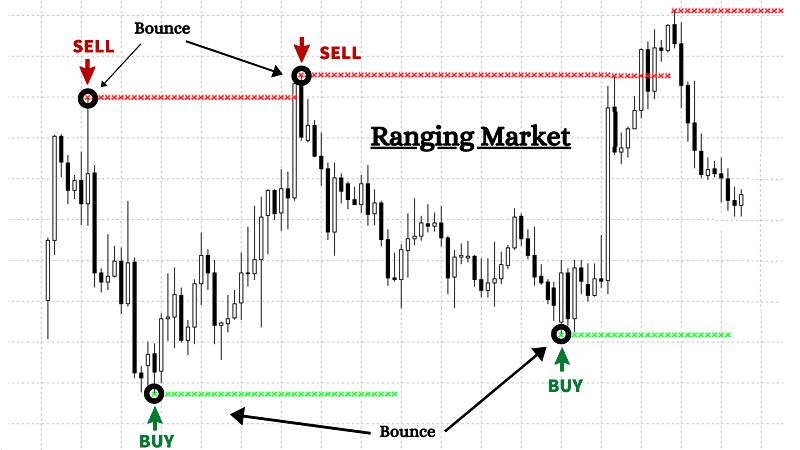
1- Range Trading : Bounce
This is a sideways trading strategy in markets that do not have a clearly defined trend and prices tend to oscillate between support and resistance zones.
The strategy is therefore to look for buy trades when prices are close to the support level and sell trades when prices are close to the resistance level.
Here is a concrete example

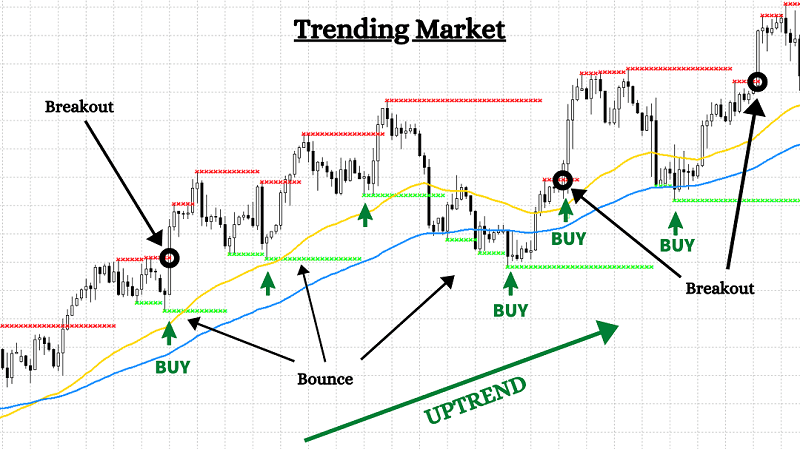
2- Trend Trading : Bounce & Breakout
This is the easiest way to take advantage of a breakout or rebound in trending markets. In an uptrend, the lines of this indicator will act as buy signals, while in a downtrend, they will act as sell signals.
The strategy is therefore to:
- Look for buy trades if the market is in an uptrend, one enters the trade when the price breaks through the resistance
or if the price is near the support level.
- Look for sell trades if the market is in a downtrend, one enters the trade when the price crosses the support down
or if the price is near the resistance level.


